
October 8, 2026 · Surveying, LiDAR, Yukon Surveyor
Open Pit Volumes from Drone LiDAR: Designing a Pit on a Real Surface and Counting Every Cubic Metre
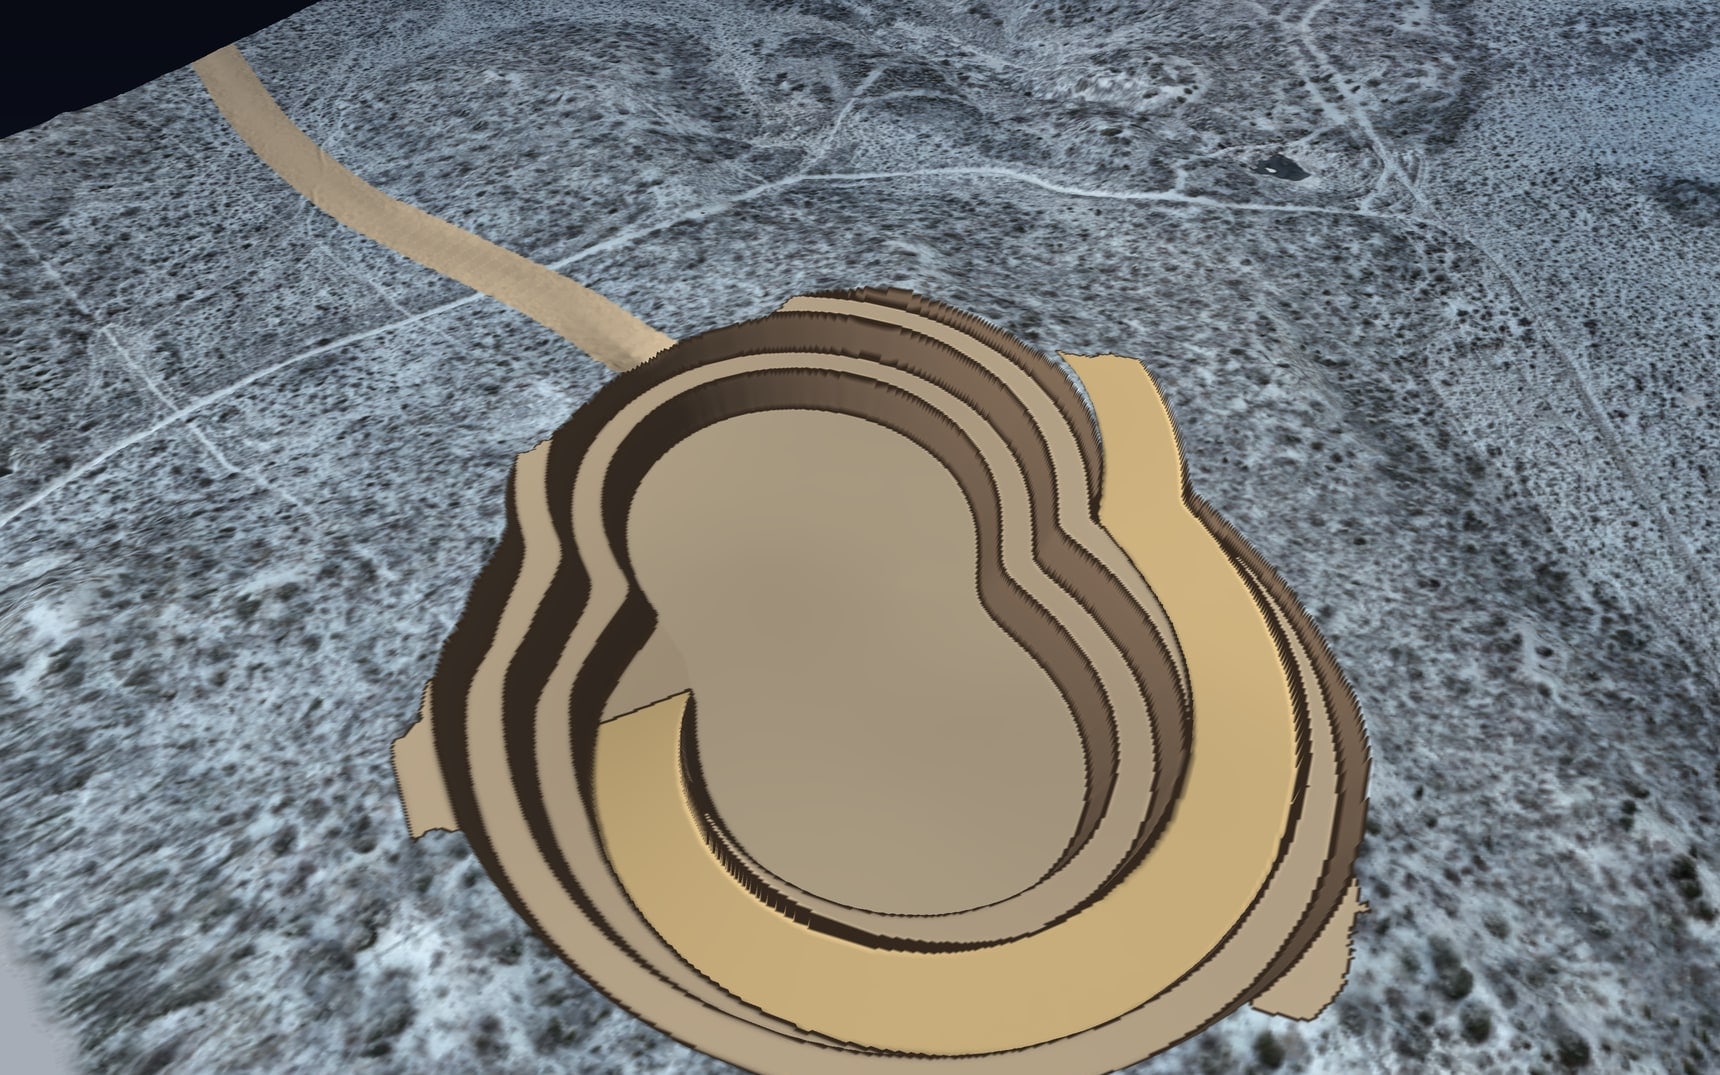
A benched pit with a spiral ramp and a haul road, designed onto a real LiDAR surface from a northern site. Here is how the volume is calculated, bench by bench.
Start with a surface you can trust
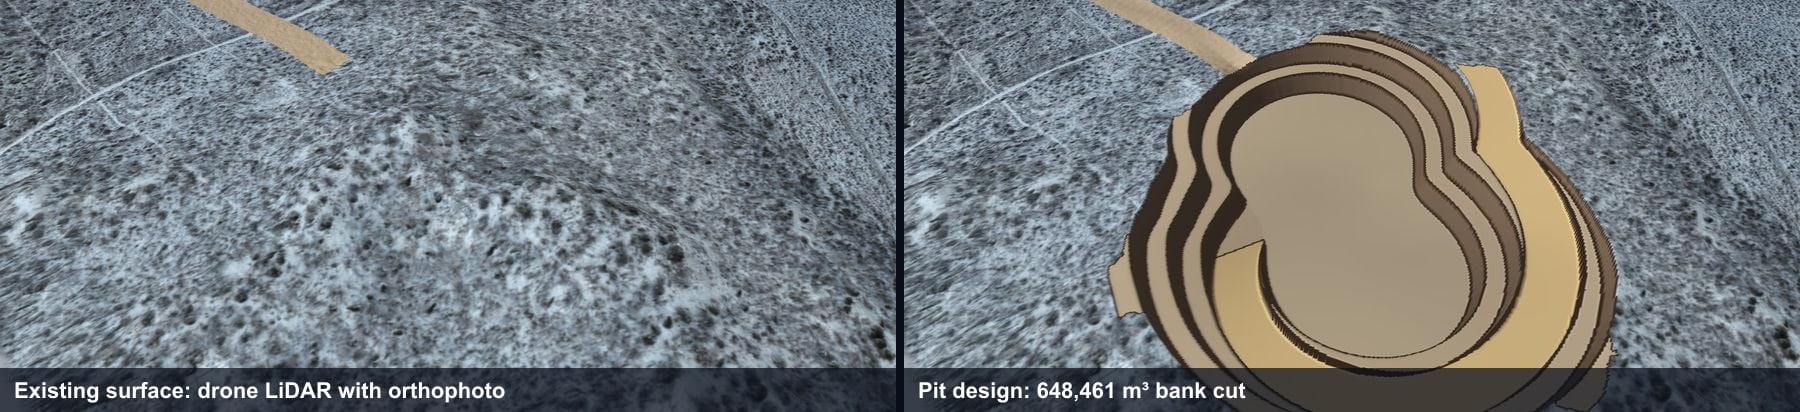
Every volume in mining comes from the same operation: one surface subtracted from another. Pit design against existing ground. This month's survey against last month's. Stockpile against the pad it sits on. The arithmetic is simple. The number is only as good as the surfaces, and on a northern site the existing surface is the hard part, because it is big, remote and usually covered in trees.This post walks through a complete example on real PCI data. A drone LiDAR flight over a remote northern site produced a bare-earth terrain model at half a metre per cell, with an orthophoto at ten centimetres per pixel from the camera flown alongside the scanner. We picked a knoll on that surface and designed a small open pit into it, then calculated the cut volume the way PCI calculates volumes for clients: surface to surface, every cell, no shortcuts. The pit is a design exercise, not a mine plan, but the surface, the method and the numbers are exactly what a project would receive.
The design
A real pit is never a circle. Ore bodies are long and lean to one side, so the pit follows them, and the ramp has to get trucks from the crest to the floor at a grade they can climb loaded. This design uses the ingredients of a working open pit at a scale that fits the knoll:| Design element | Value |
|---|---|
| Pit floor | 776 m, roughly 170 m by 60 m |
| Benches | 5 benches, 10 m high |
| Bench face angle | 70 degrees |
| Catch berms | 8 m wide |
| Ramp | 20 m wide, spiralling clockwise from the north-east crest at about 7 percent |
| Haul road | Surface road from the ramp portal heading north-east, graded to the existing ground |
| Crest elevation | 793 m on the low side to 807 m on the high side |
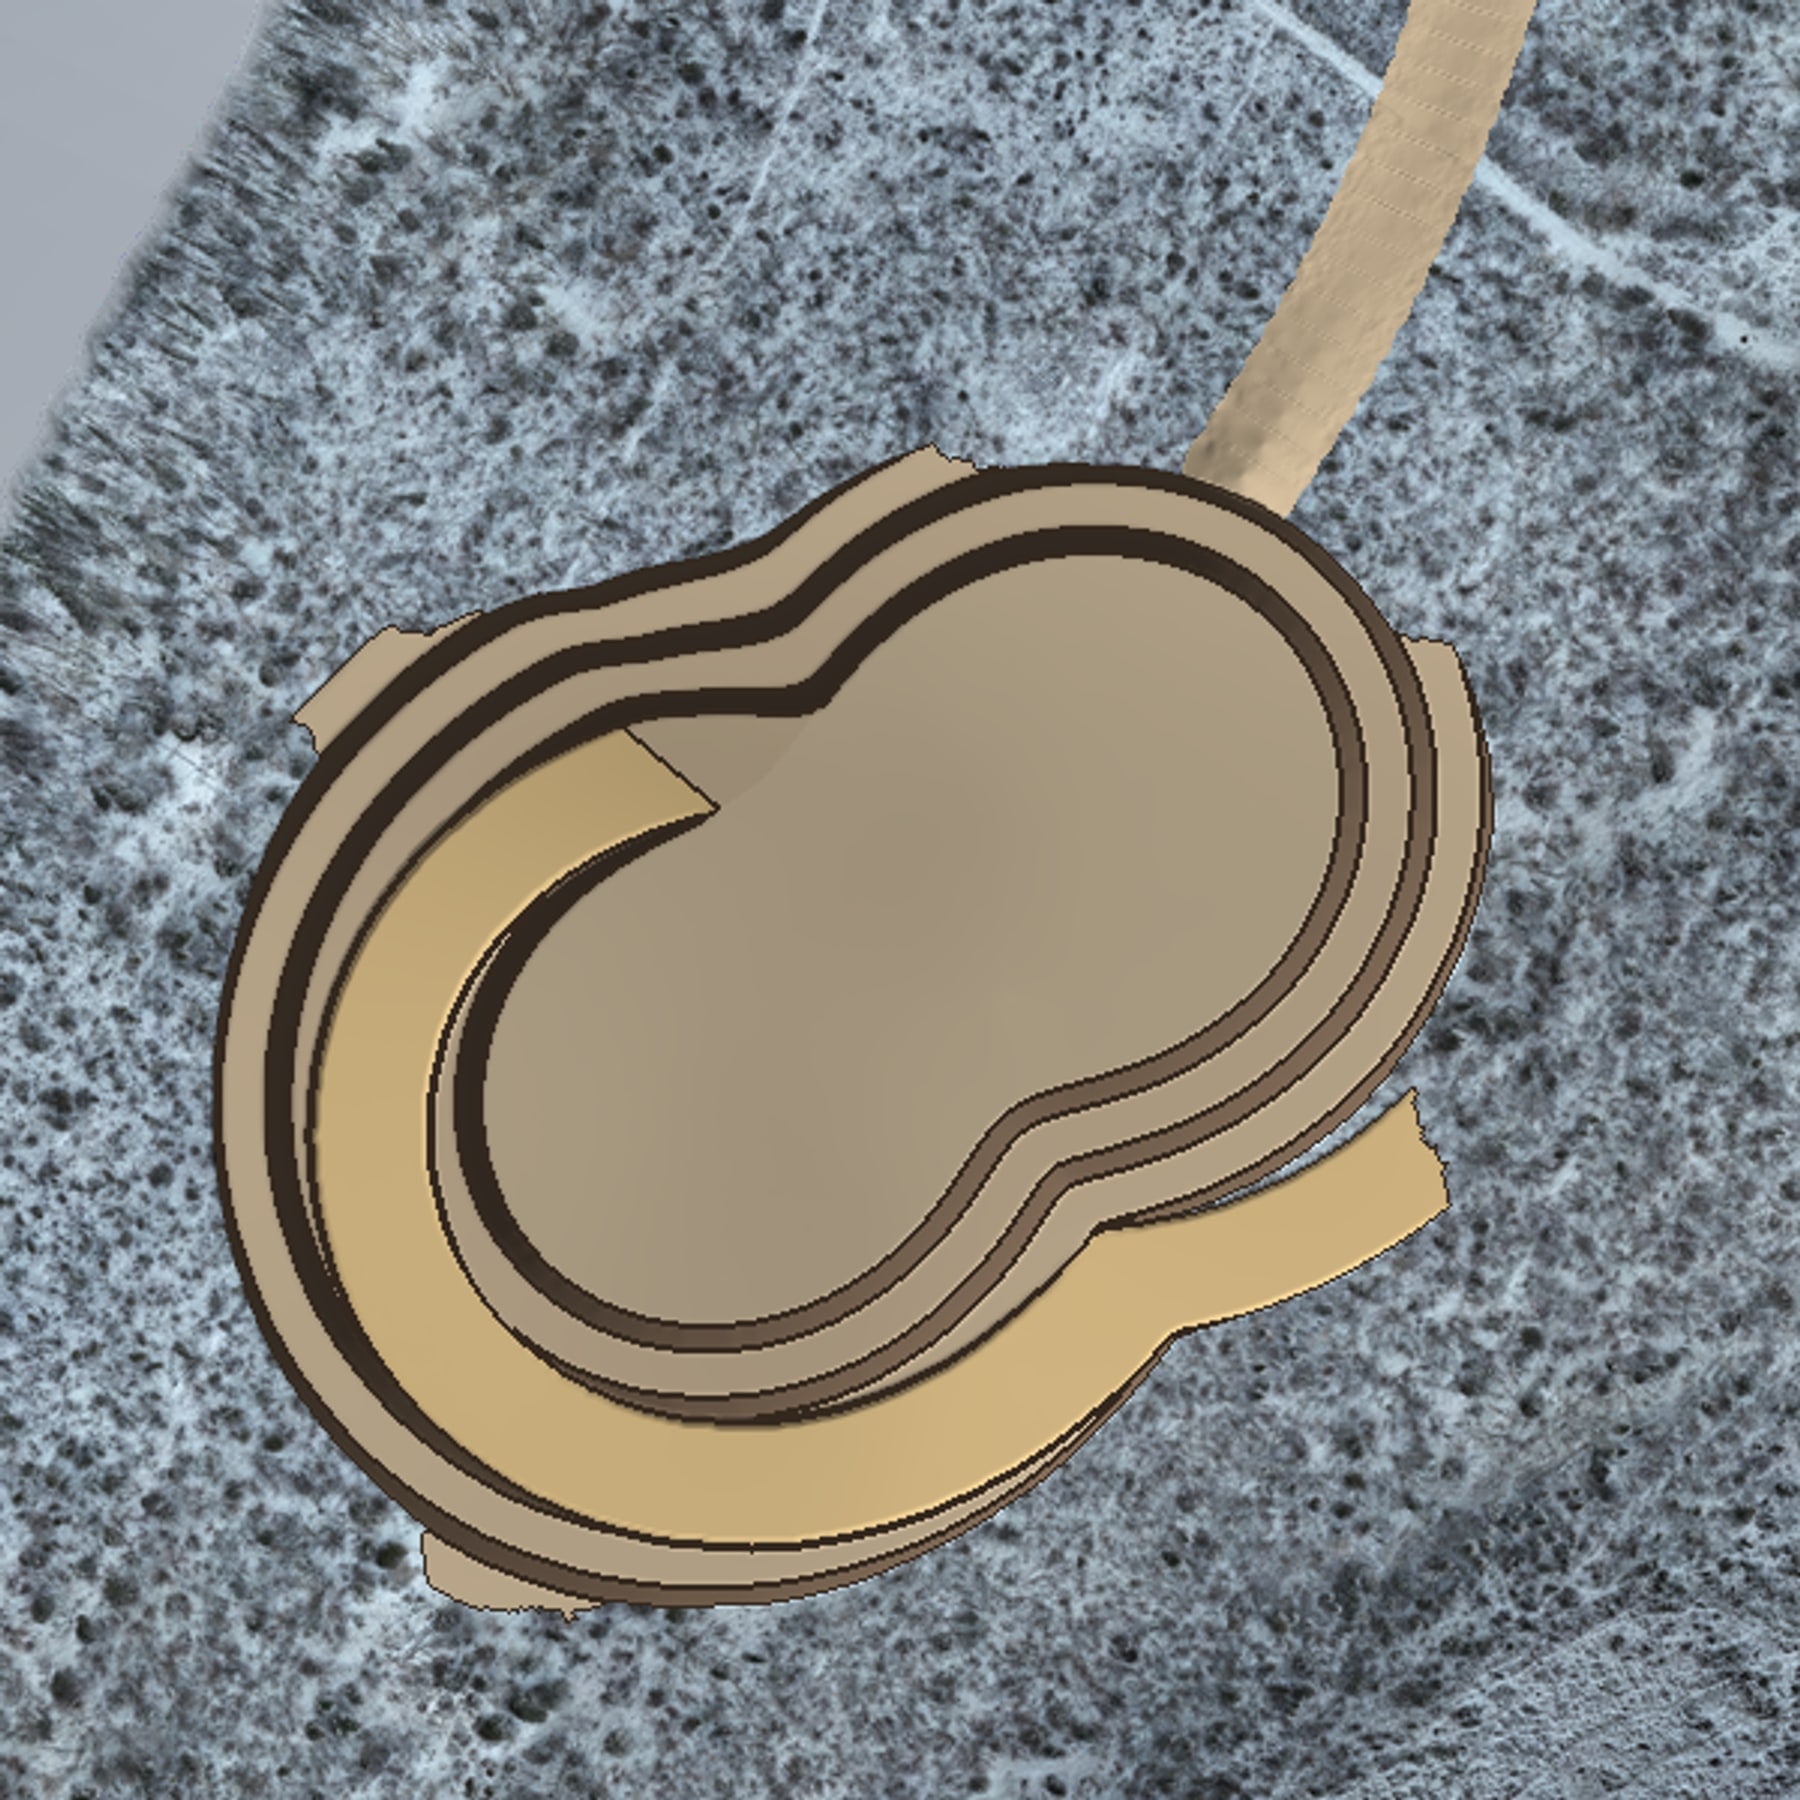
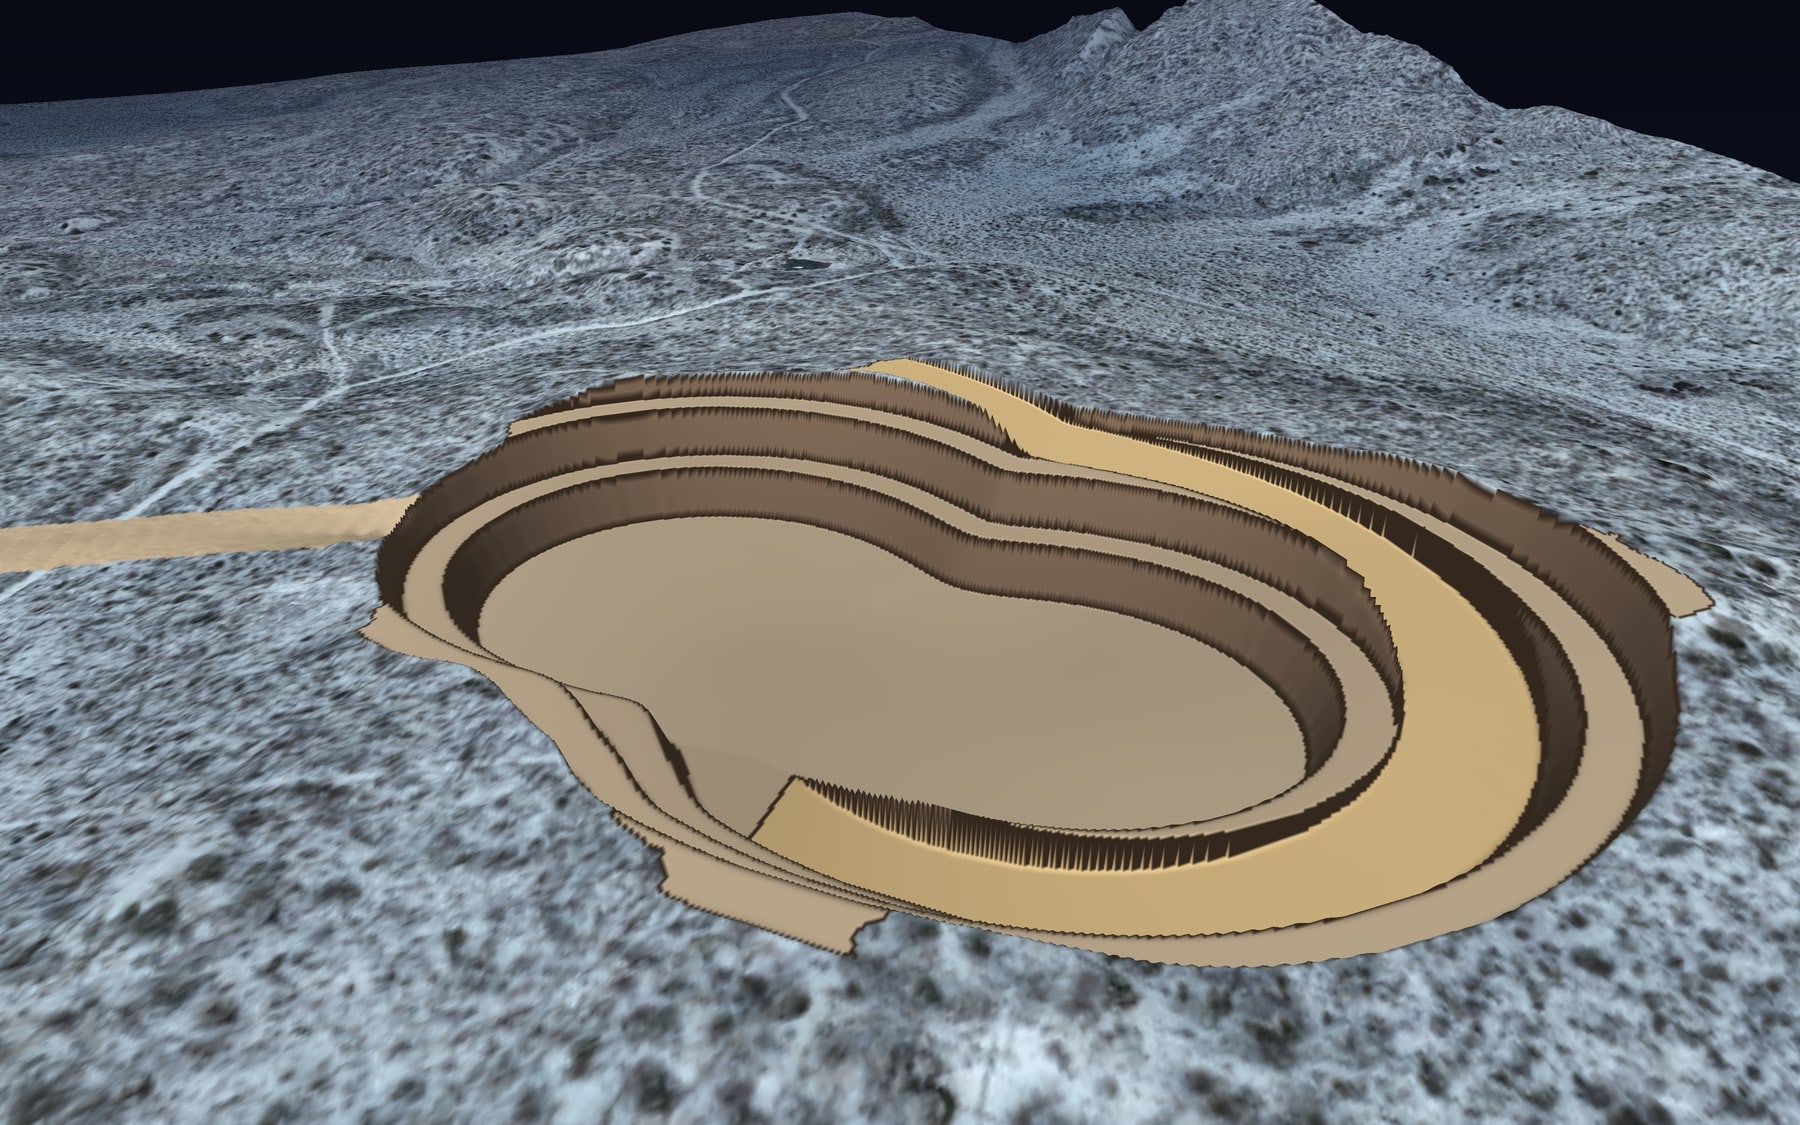
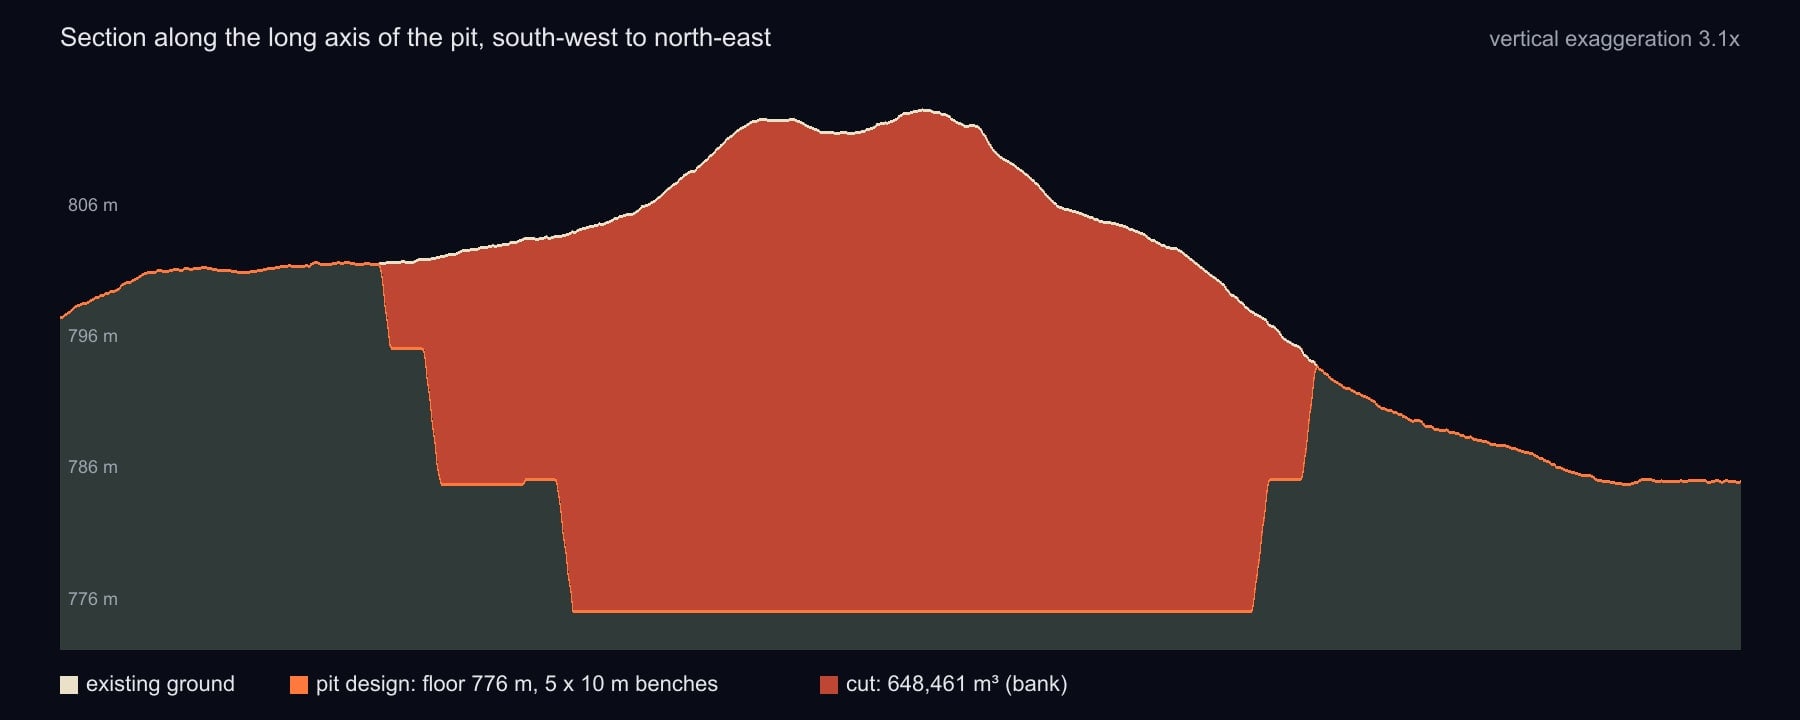
Because the knoll is not symmetric, the pit is not either. On the high side the design cuts through all five benches. On the low side it daylights after two, so the crest is lower there and the pit wall is shorter. That is normal and it matters for the volume: a third of the design footprint never reaches full depth.
The volume, cell by cell
The design surface and the existing surface share the same half-metre grid, so the cut at every cell is simply the existing elevation minus the design elevation, and the volume is that depth times the cell area, summed across the pit. There is no averaging of end areas and no interpolation between cross sections. The pit covers 124,000 cells and every one is counted.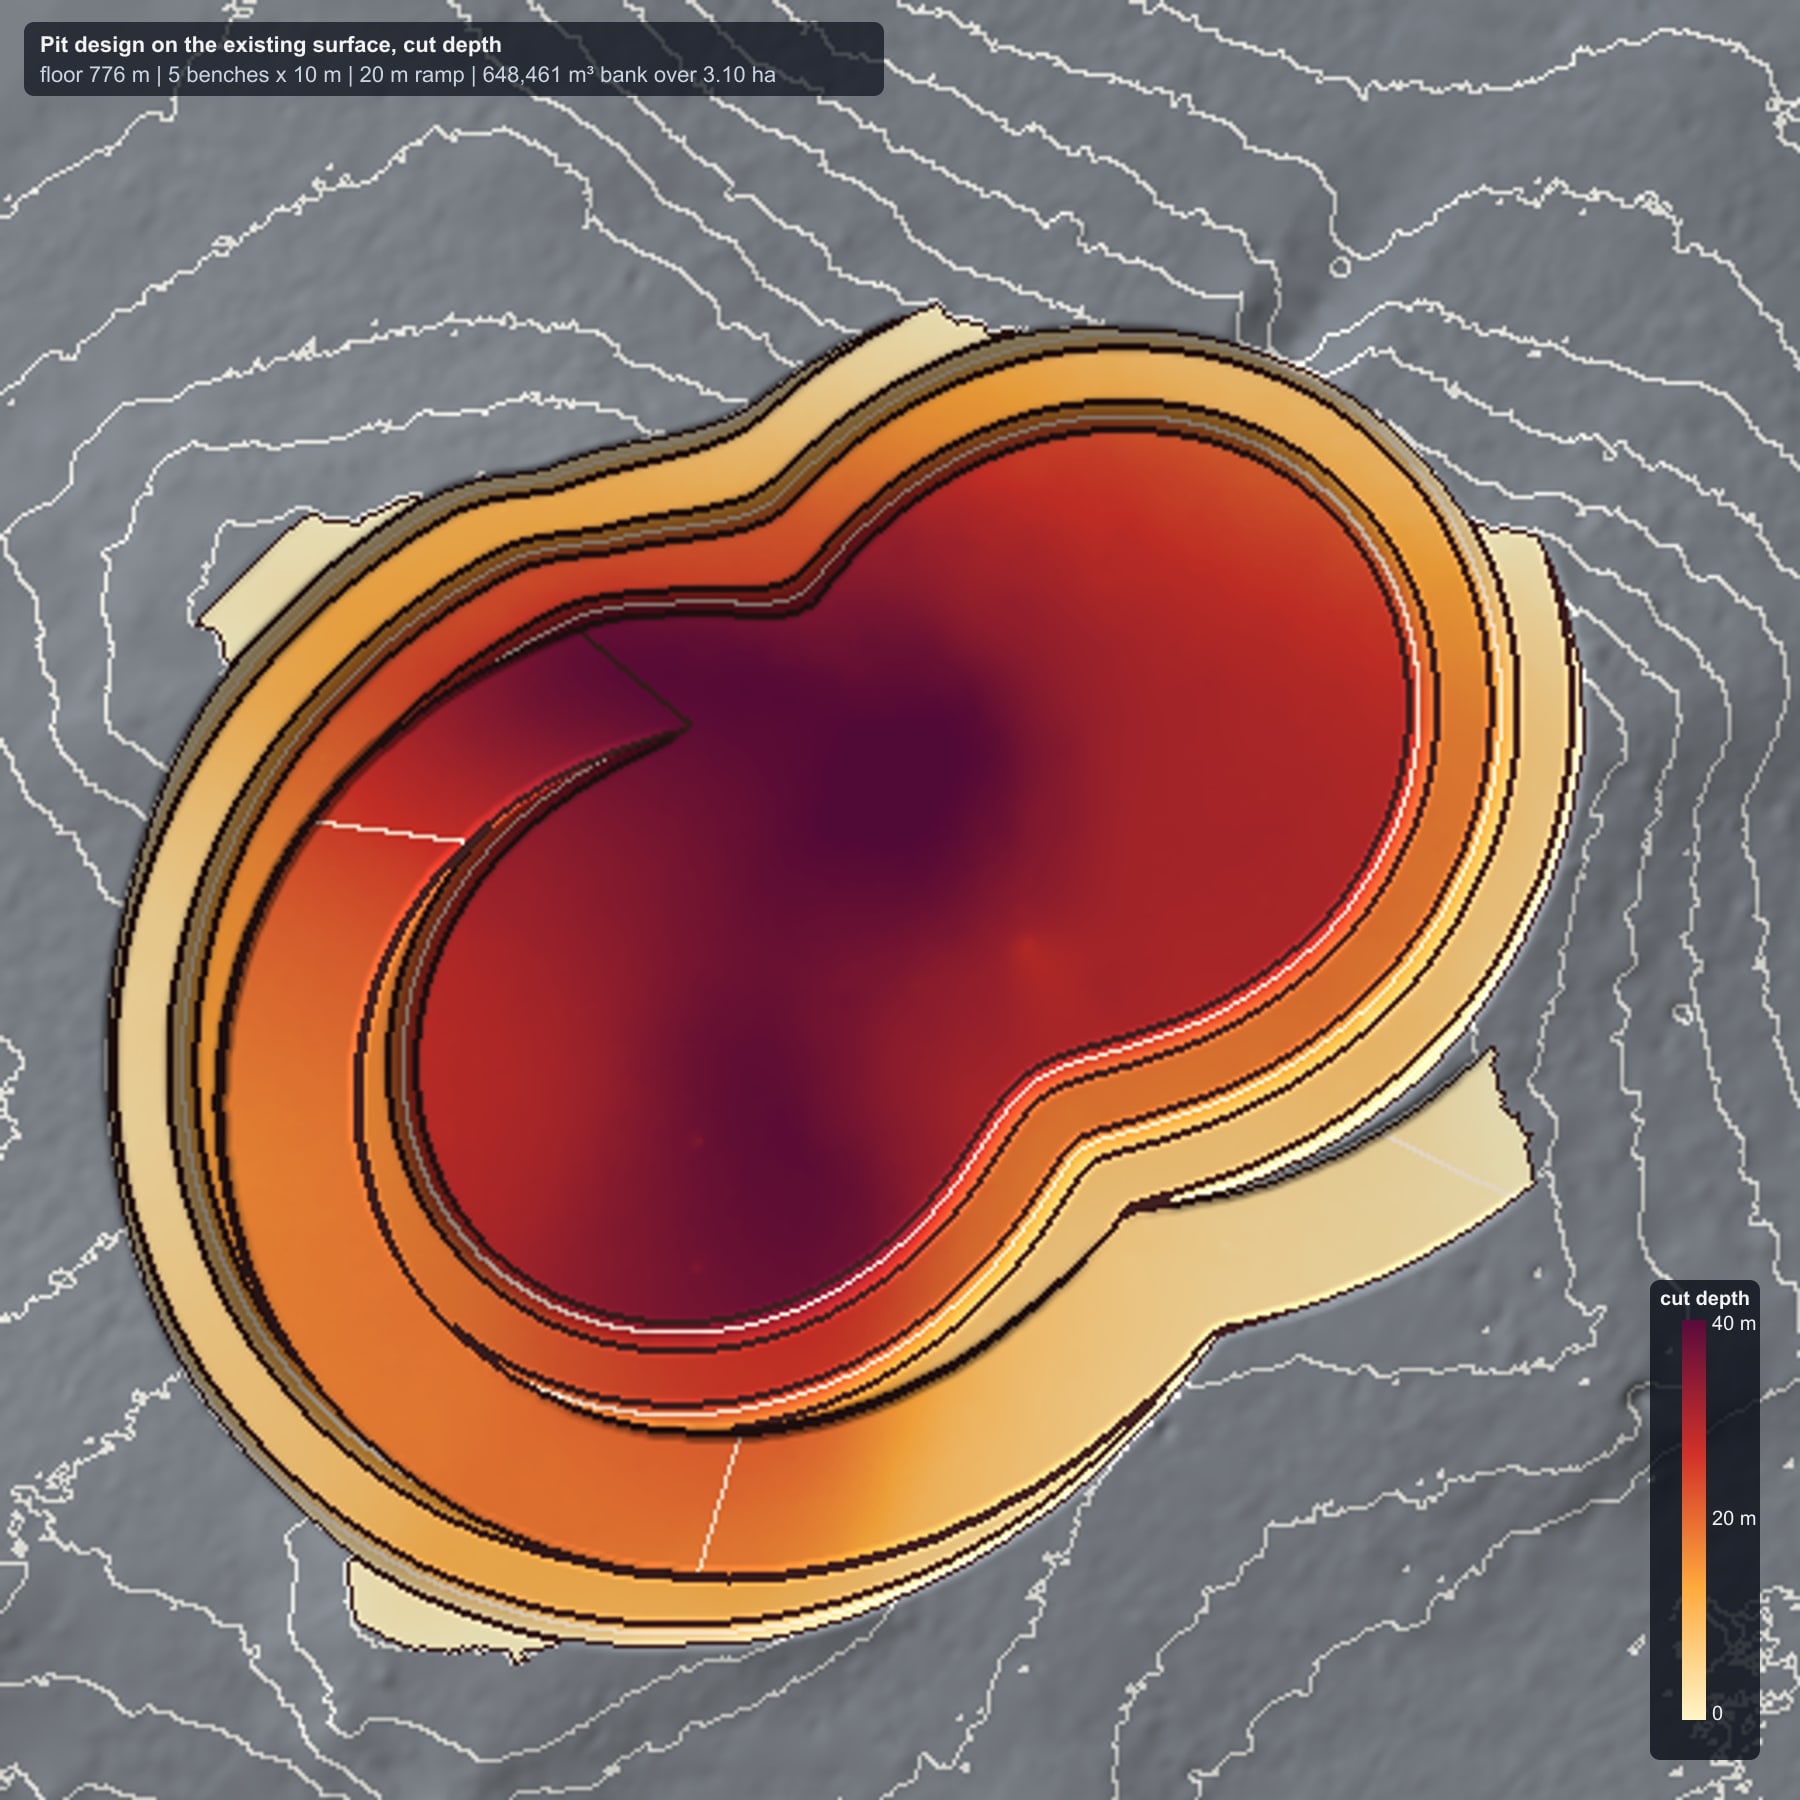
| Quantity | Value |
|---|---|
| Total cut, bank | 648,461 m³ |
| Pit footprint | 3.10 ha |
| Pit floor area | 1.14 ha |
| Maximum cut depth | 41.2 m |
| Average cut depth over the footprint | 20.9 m |
| Cut inside the ramp | 98,955 m³ |
The same calculation can be sliced by elevation, which is how the number turns into a schedule. Each bench is a mining phase, and the volume per bench tells the planner how much material comes out before the next one opens:
| Bench | Elevation | Bank volume |
|---|---|---|
| Bench 5 (top) | 806 m to crest | 55,286 m³ |
| Bench 4 | 796 to 806 m | 238,244 m³ |
| Bench 3 | 786 to 796 m | 219,261 m³ |
| Bench 2 | 776 to 786 m | 135,670 m³ |
| Total | 648,461 m³ |
The top bench is small because most of the knoll sits below 806 m; the bottom bench is small because the floor is a fraction of the crest area. The middle two benches carry the tonnes. That shape of the curve is typical, and it is the reason a volume broken out by bench is worth more to a planner than a single total.
Bank, loose and tonnes
The 648,461 m³ is bank volume: rock in place, measured against the ground it is in. It is the number a design is compared to and the number that goes on a progress claim, because it is measured, not assumed. The other two numbers that everyone asks for depend on assumptions that belong to the project:- Loose volume is bank volume plus swell. At a 25 percent swell factor, this pit produces about 811,000 m³ of loose material to haul and place. The swell factor depends on the rock and how it breaks, and a few weeks of truck counts will pin it down.
- Tonnes are bank volume times in-situ density. At 2.6 t/m³ this pit holds about 1.69 million tonnes. Density comes from the geology, not the survey, so PCI reports the measured volume and applies the factor the project specifies.
What moves the number
A volume can be no better than the two surfaces, and three things decide how good those are.Control. Both surfaces have to sit in the same coordinate system to a few centimetres, or the difference between them is partly real and partly misregistration. Every PCI LiDAR flight is tied to GNSS control and checked against independent checkpoints, and the accuracy report that ships with the data says how well it fits.
Ground, not canopy. On a forested site a photogrammetry surface is a tree-top surface, and a volume calculated against it is wrong by the height of the trees. LiDAR reaches the ground between the stems, and the bare-earth model is classified ground returns only. For the difference, see photogrammetry versus LiDAR.
Snow is surface, not ground. The laser measures the top of the snowpack. The surface used here was flown late in the season with snow on the ground, which is fine for a design exercise and for progress surveys compared against each other, but a baseline for a contract volume is flown before the snow or with snow depths measured and removed.
With those three handled, the cell-by-cell calculation itself is exact to the grid, and a half-metre grid on a 3 ha pit resolves the walls, the berms and the ramp individually. Coarser grids smooth the benches away and the volume drifts with them.
The same method, every month
Everything above is one subtraction, and the same subtraction runs the life of a mine. Fly the pit monthly and the difference between flights is the production volume for the period, by bench, by phase, by contractor. Fly the waste dumps and the stockpiles on the same day and the material balance closes. For stockpiles the base surface is surveyed once, before the pile goes down, and every later flight is compared to it. For cut and fill on a pad or a haul road, the design surface stands in for the second survey, and the report shows cut, fill and the net in one table.What PCI delivers from a volume survey:
- the classified point cloud and bare-earth terrain model, with the accuracy report;
- the orthophoto from the same flight, for the record of what was on the ground that day;
- cut, fill and net volumes by area, by bench or by stockpile, as a signed report and as a spreadsheet;
- a cut-and-fill depth map and sections like the ones above, so the numbers can be checked by eye;
- the surfaces themselves, in the formats your mine planning or earthworks software reads, so your engineers can run their own comparison.
Related: earthworks and volume surveys, mining surveying, drone LiDAR, what a drone LiDAR survey delivers, mining surveying in northern BC and the Yukon, and the Yukon mining surveying page. PCI is a First Nations owned company; see First Nations partnerships for how we work with communities on resource projects.
Get a price for a volume survey
Outline the pit, the dumps or the stockpile pad on the map, tell us how often you need it flown, and you will usually see a price as soon as you submit. Remote site? Say so, and the mobilization is planned into the quote. Crews work from Prince George, Edmonton, Vancouver and Whitehorse.Request a quote or call the office nearest your project. Crews are out seven days a week, 6 a.m. to 7 p.m.


