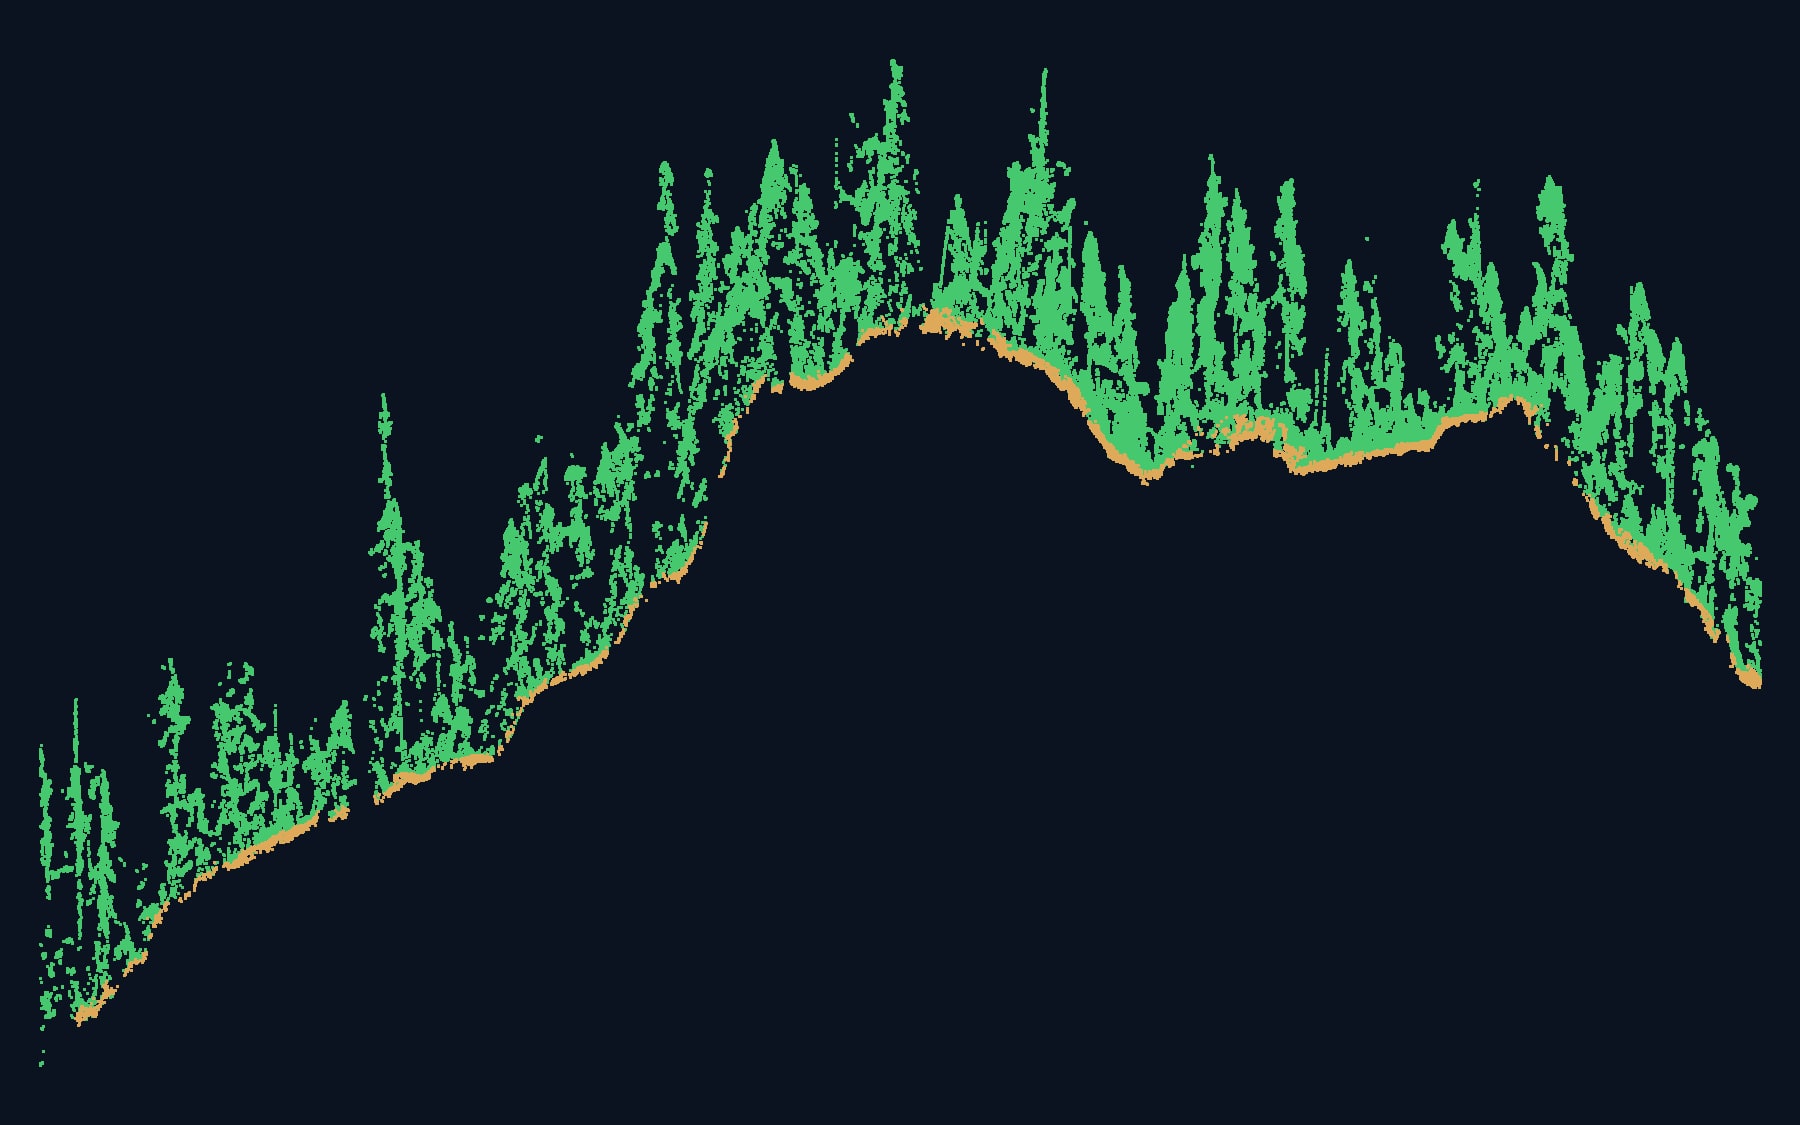
The point cloud is the master. Everything else is derived.
A LiDAR sensor does not produce a map. It produces measurements: tens of millions of them on a typical site. Each one is a coordinate with an elevation, a return intensity, and after processing, a classification: this point is ground, this one is vegetation, this one is a structure.
The image at the top of this post is a vertical slice a few metres wide through a point cloud. Tan points are ground. Green points are everything the laser hit on the way down: tree crowns, branches, brush. Every deliverable below is computed from points like these, which is why the classified point cloud itself is always the first thing PCI delivers.
The six core deliverables
1. The classified point cloud
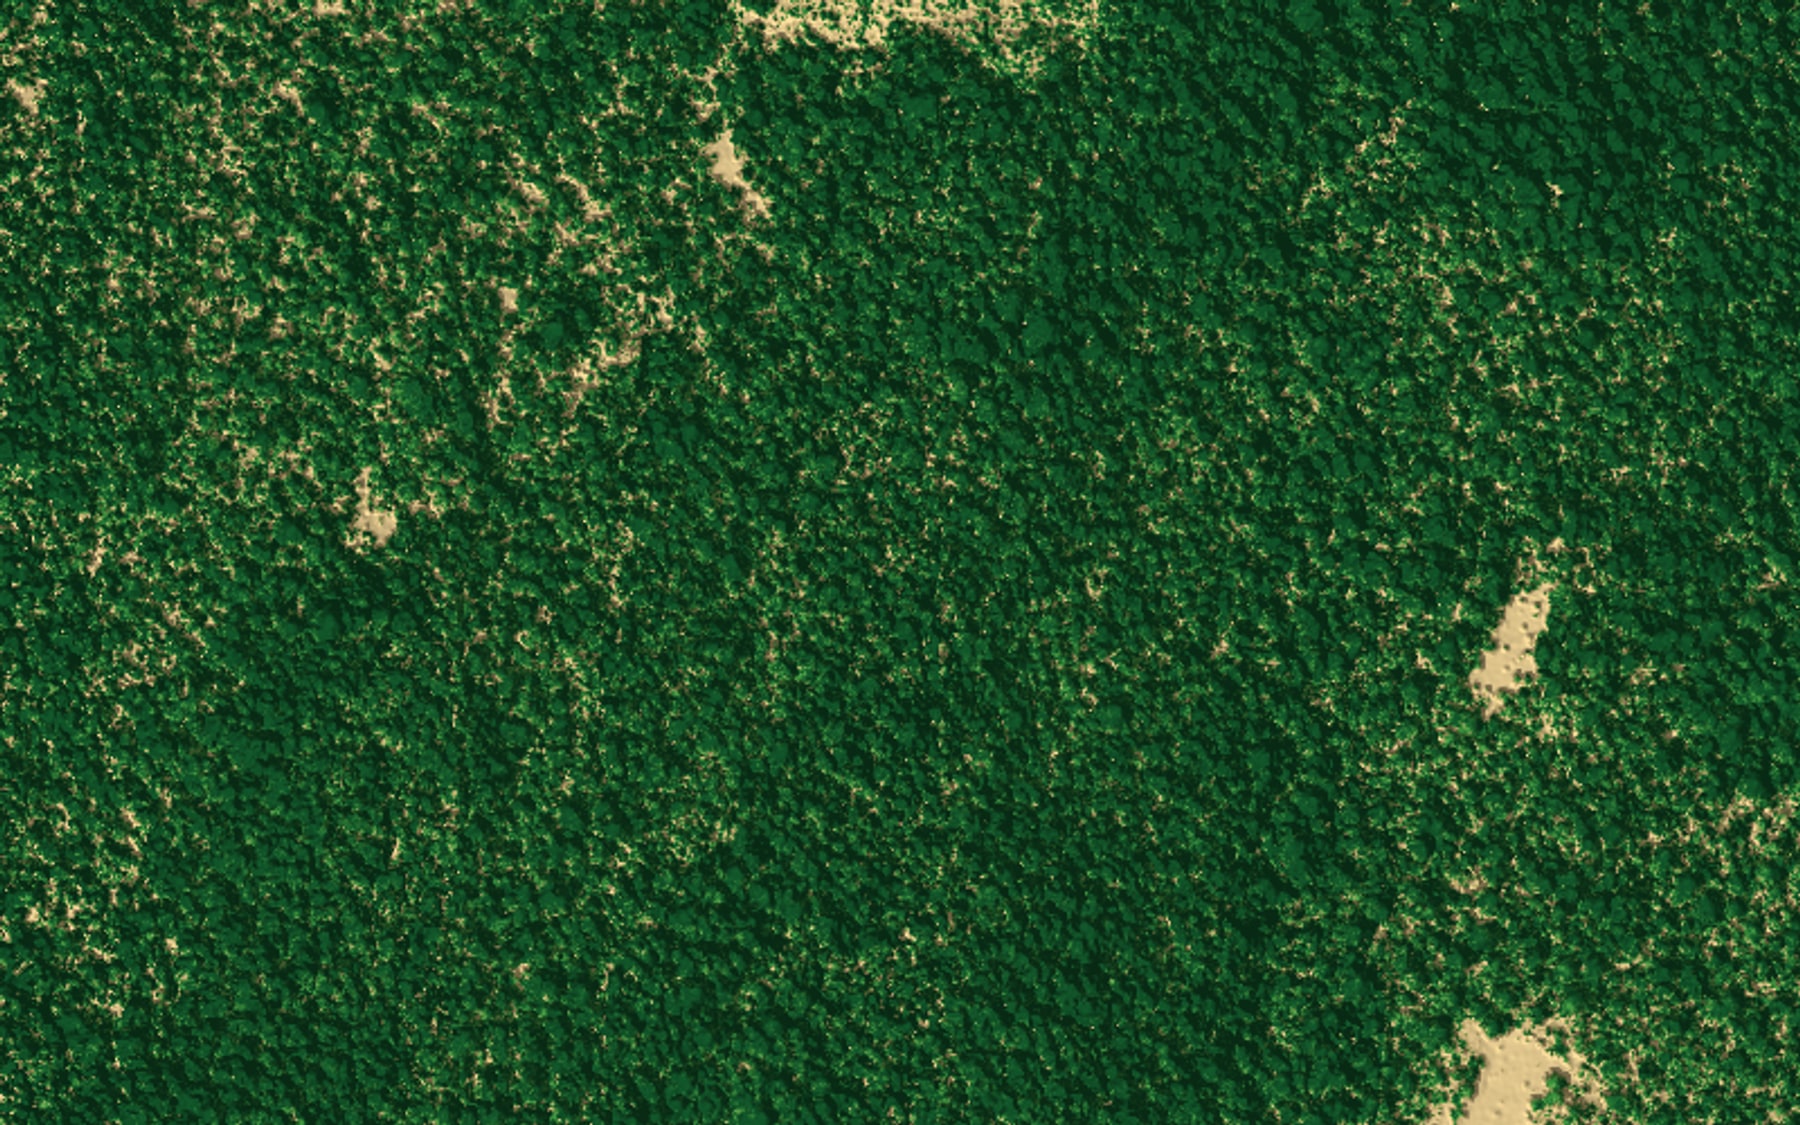
Every measurement, classified: ground, vegetation, structure. Tan is ground the laser reached; green is canopy that never let it through. In open ground almost every pulse finds the surface. Under dense canopy only a fraction do, but a fraction of tens of millions is still plenty to build a surface from. This is the master dataset everything else is derived from.
Delivered as: LAS / LAZ
2. The bare-earth terrain model
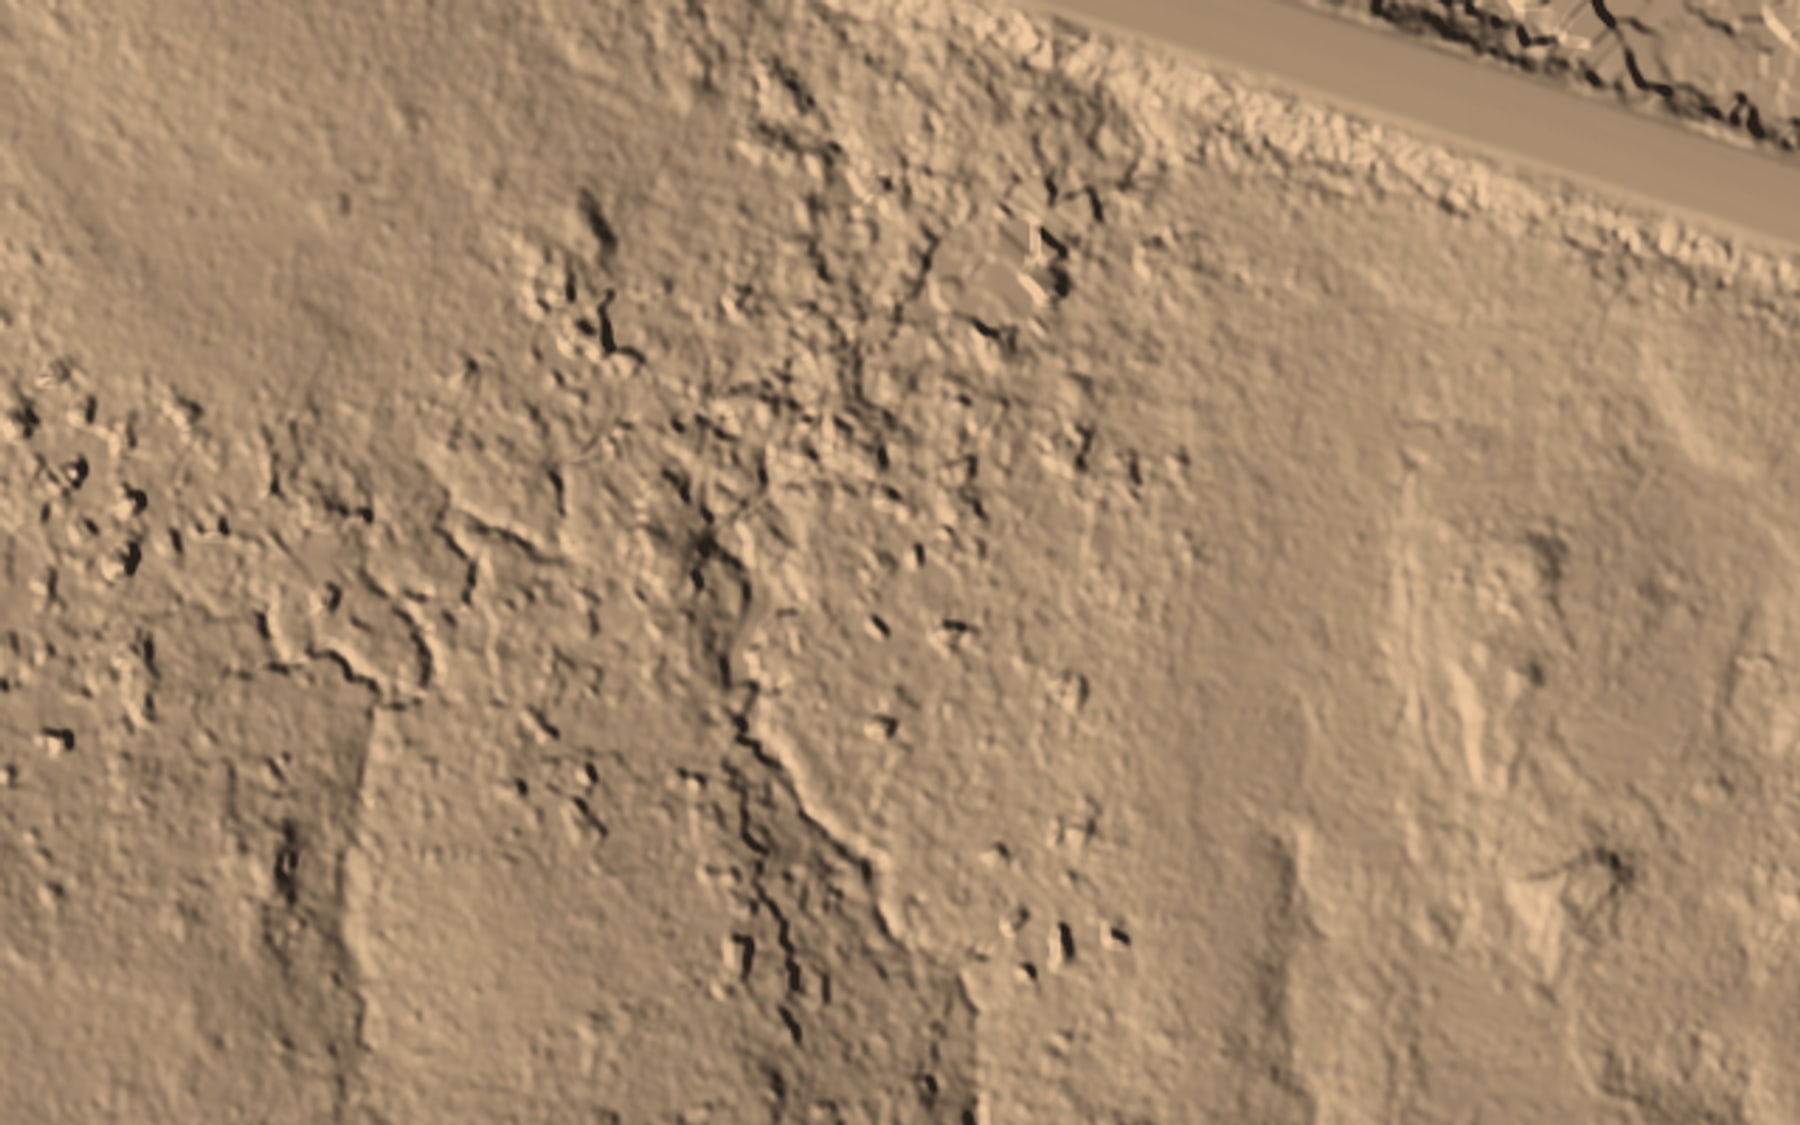
Ground points only, gridded into a surface: the digital terrain model. It shows the ground as it would look with every tree removed, and reveals what neither a photo nor a walk through the willows would: old drainage lines, subtle terraces, the true edge of a road fill. The deliverable engineers and geologists usually want most.
Delivered as: GeoTIFF · Civil 3D surface · LandXML
3. Contours
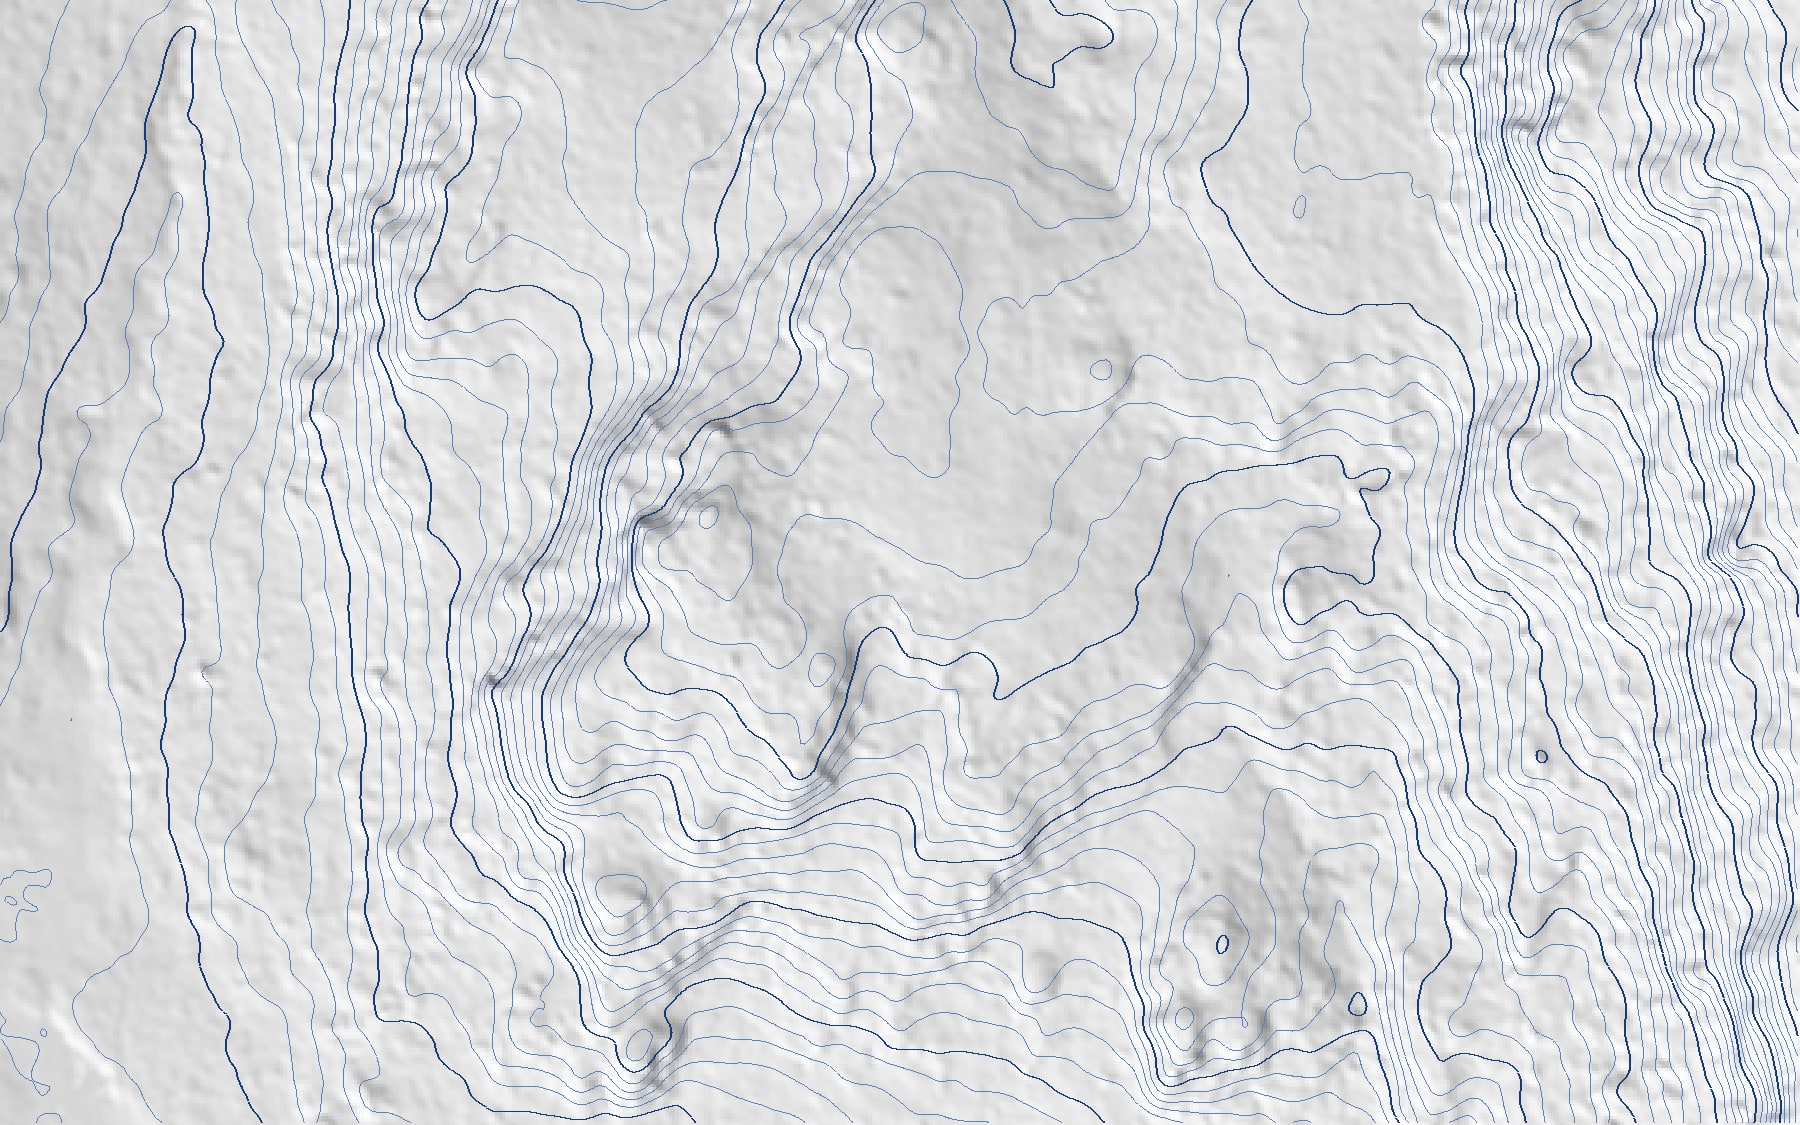
The terrain model translated into the language of drawings, at whatever interval the project needs: one metre for a site like this, half a metre on a building site, five metres on a mine. Because they come from a measured surface rather than interpolated spot heights, they hold up on the steep ground where a design either fits or does not.
Delivered as: DWG / DXF, index contours labelled and layered
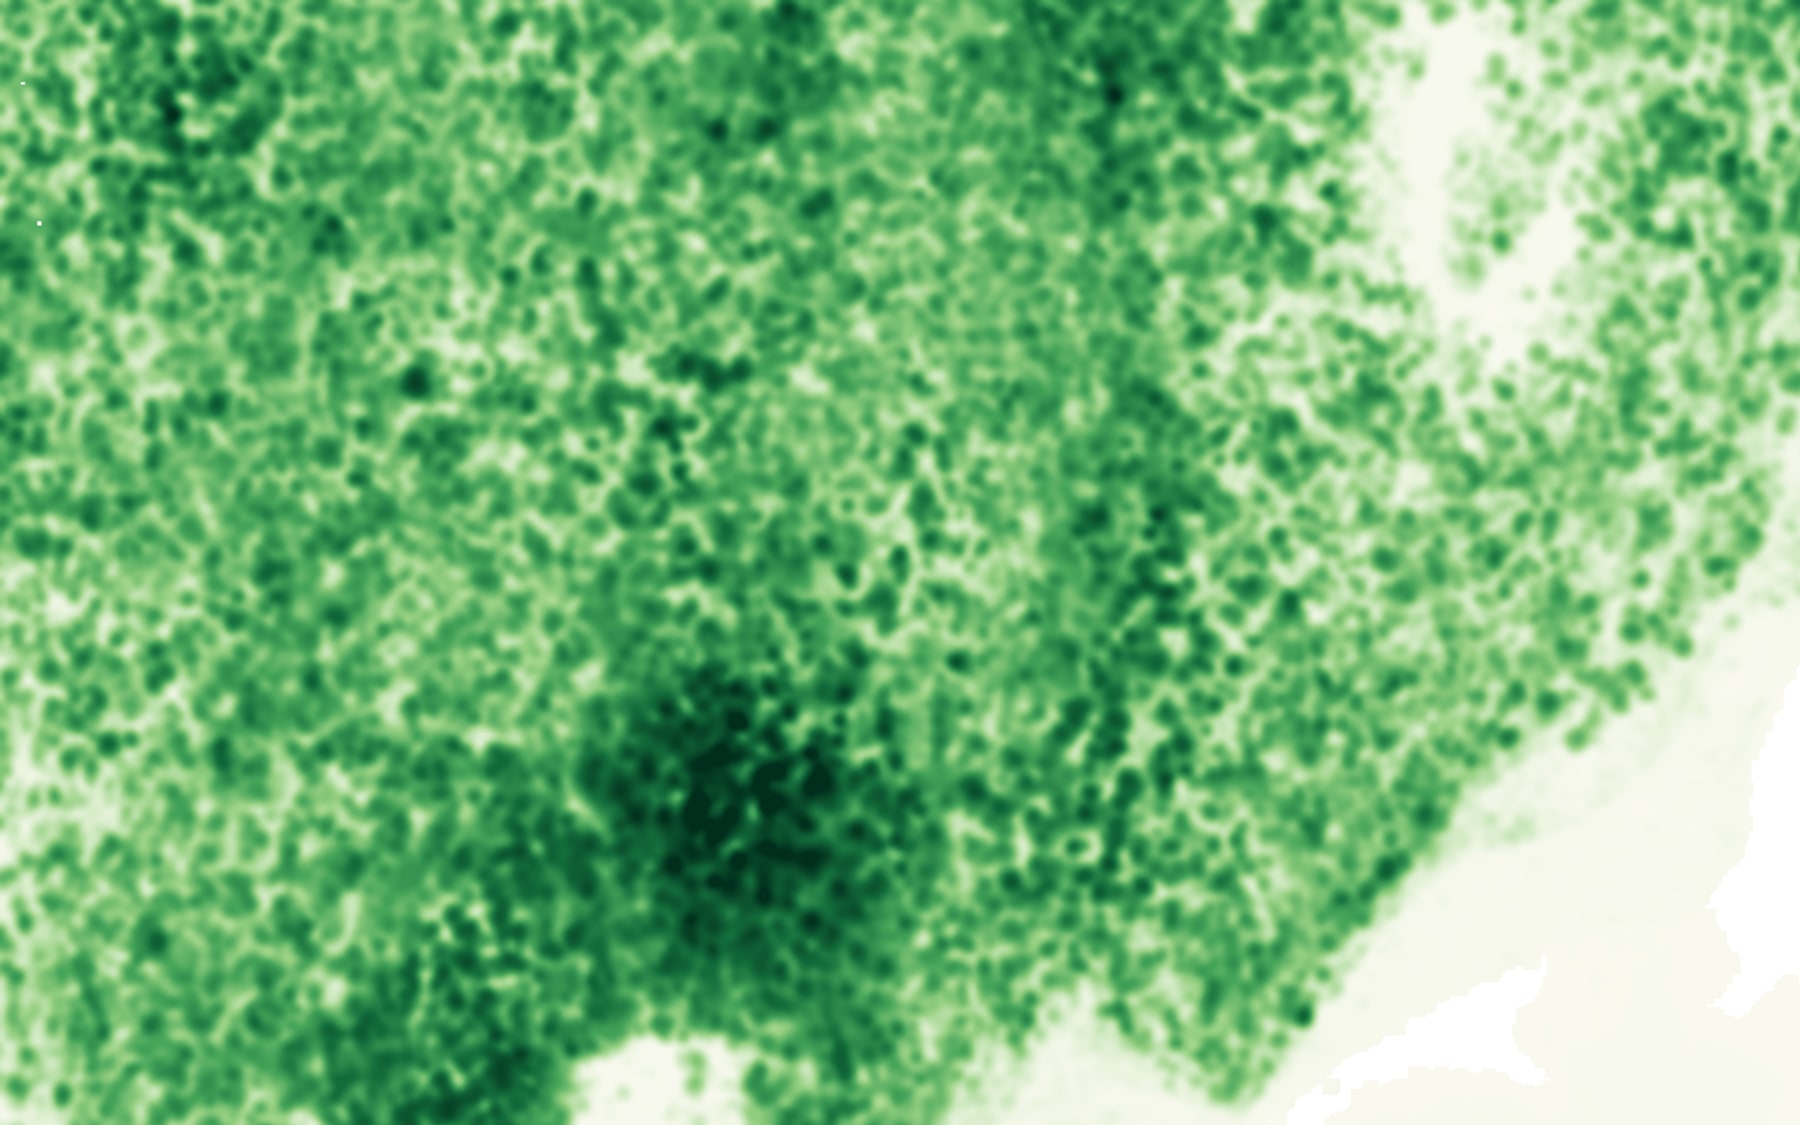
4. The canopy height model
Subtract the ground from the top of canopy and every tree on the site gets a height. Pale is open ground; the darkest green is the tallest timber. Clearing estimates, line-of-sight checks, powerline vegetation clearance, riparian assessments, anything that needs to know how tall the trees are, across the whole site, without a cruise crew walking it.
Delivered as: GeoTIFF
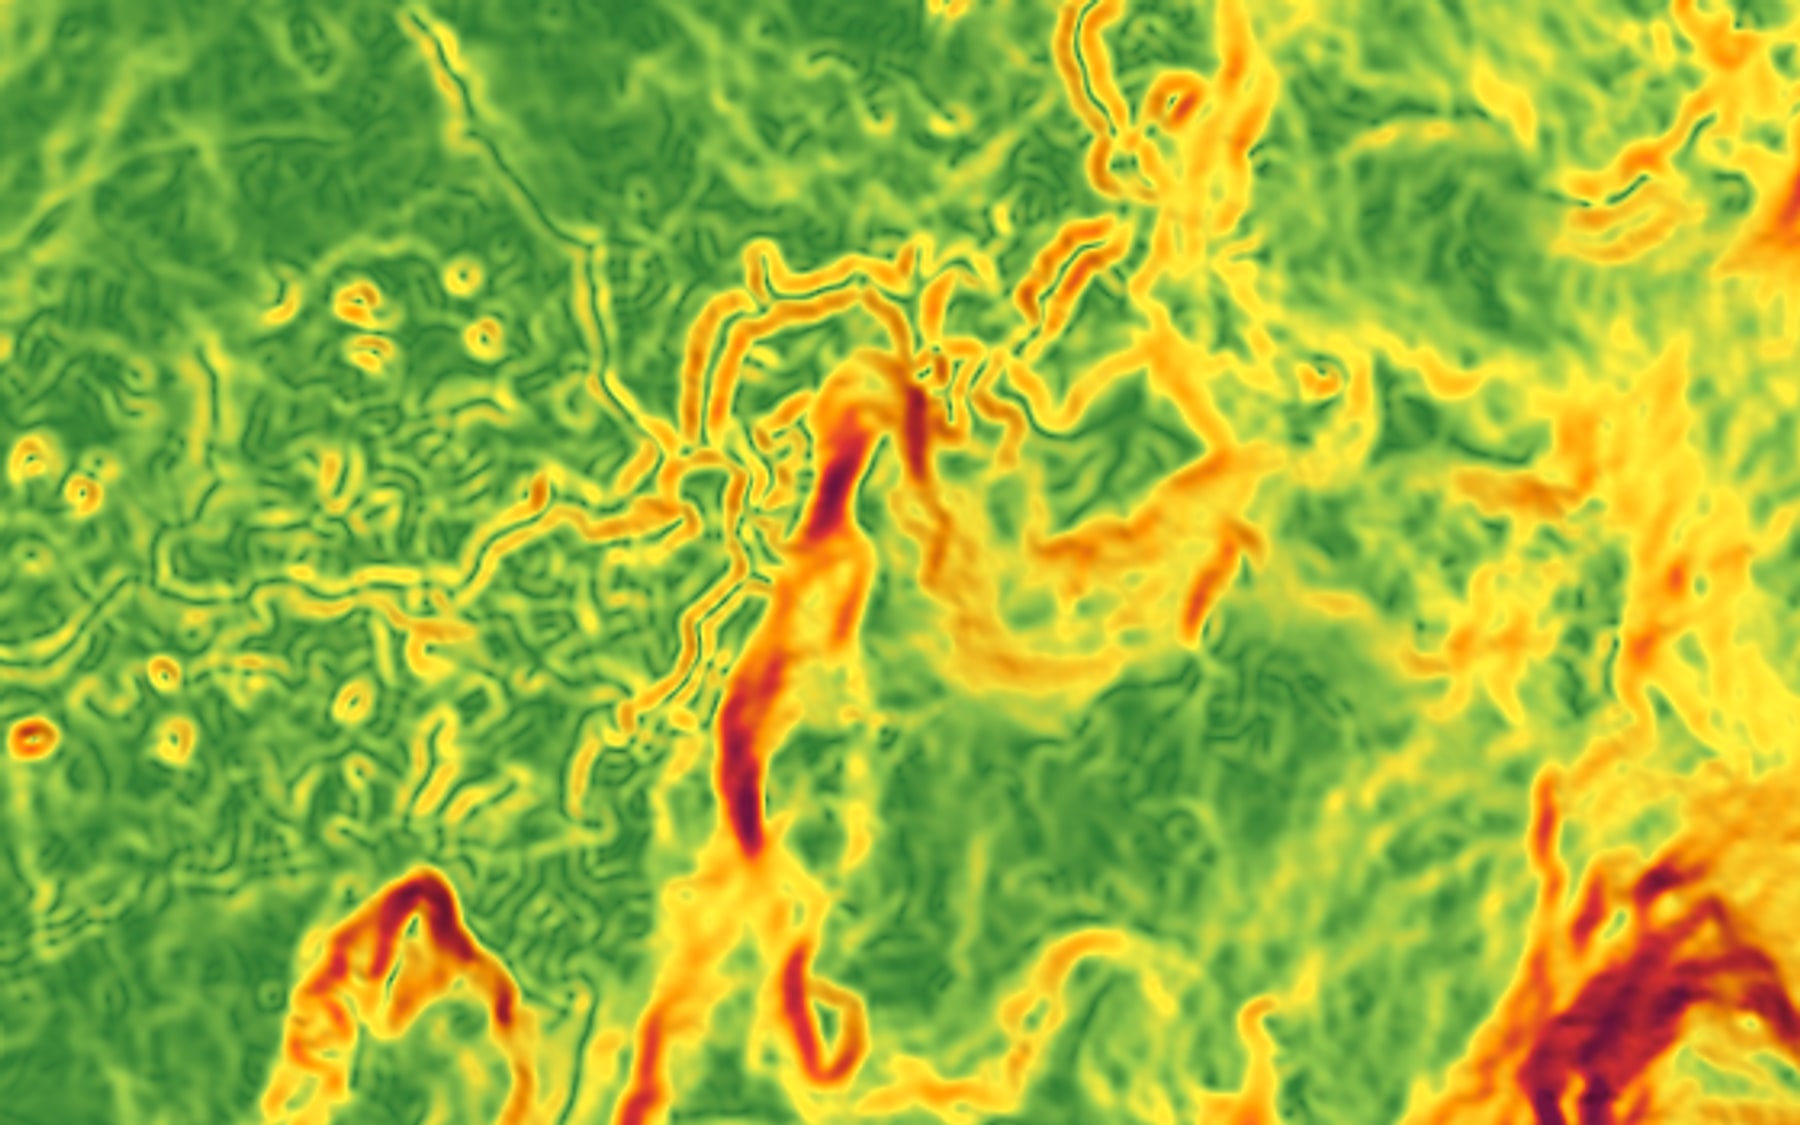
5. Slope and terrain analysis
Once the terrain model exists, terrain analysis is a matter of asking it questions. Green is flat, yellow is moderate, red is steep: a road alignment picks itself, a pad location becomes obvious, and the gullies that would swallow an excavator show up before anyone mobilizes one. Aspect, drainage and cut-and-fill against a design surface come from the same model.
Delivered as: GeoTIFF rasters
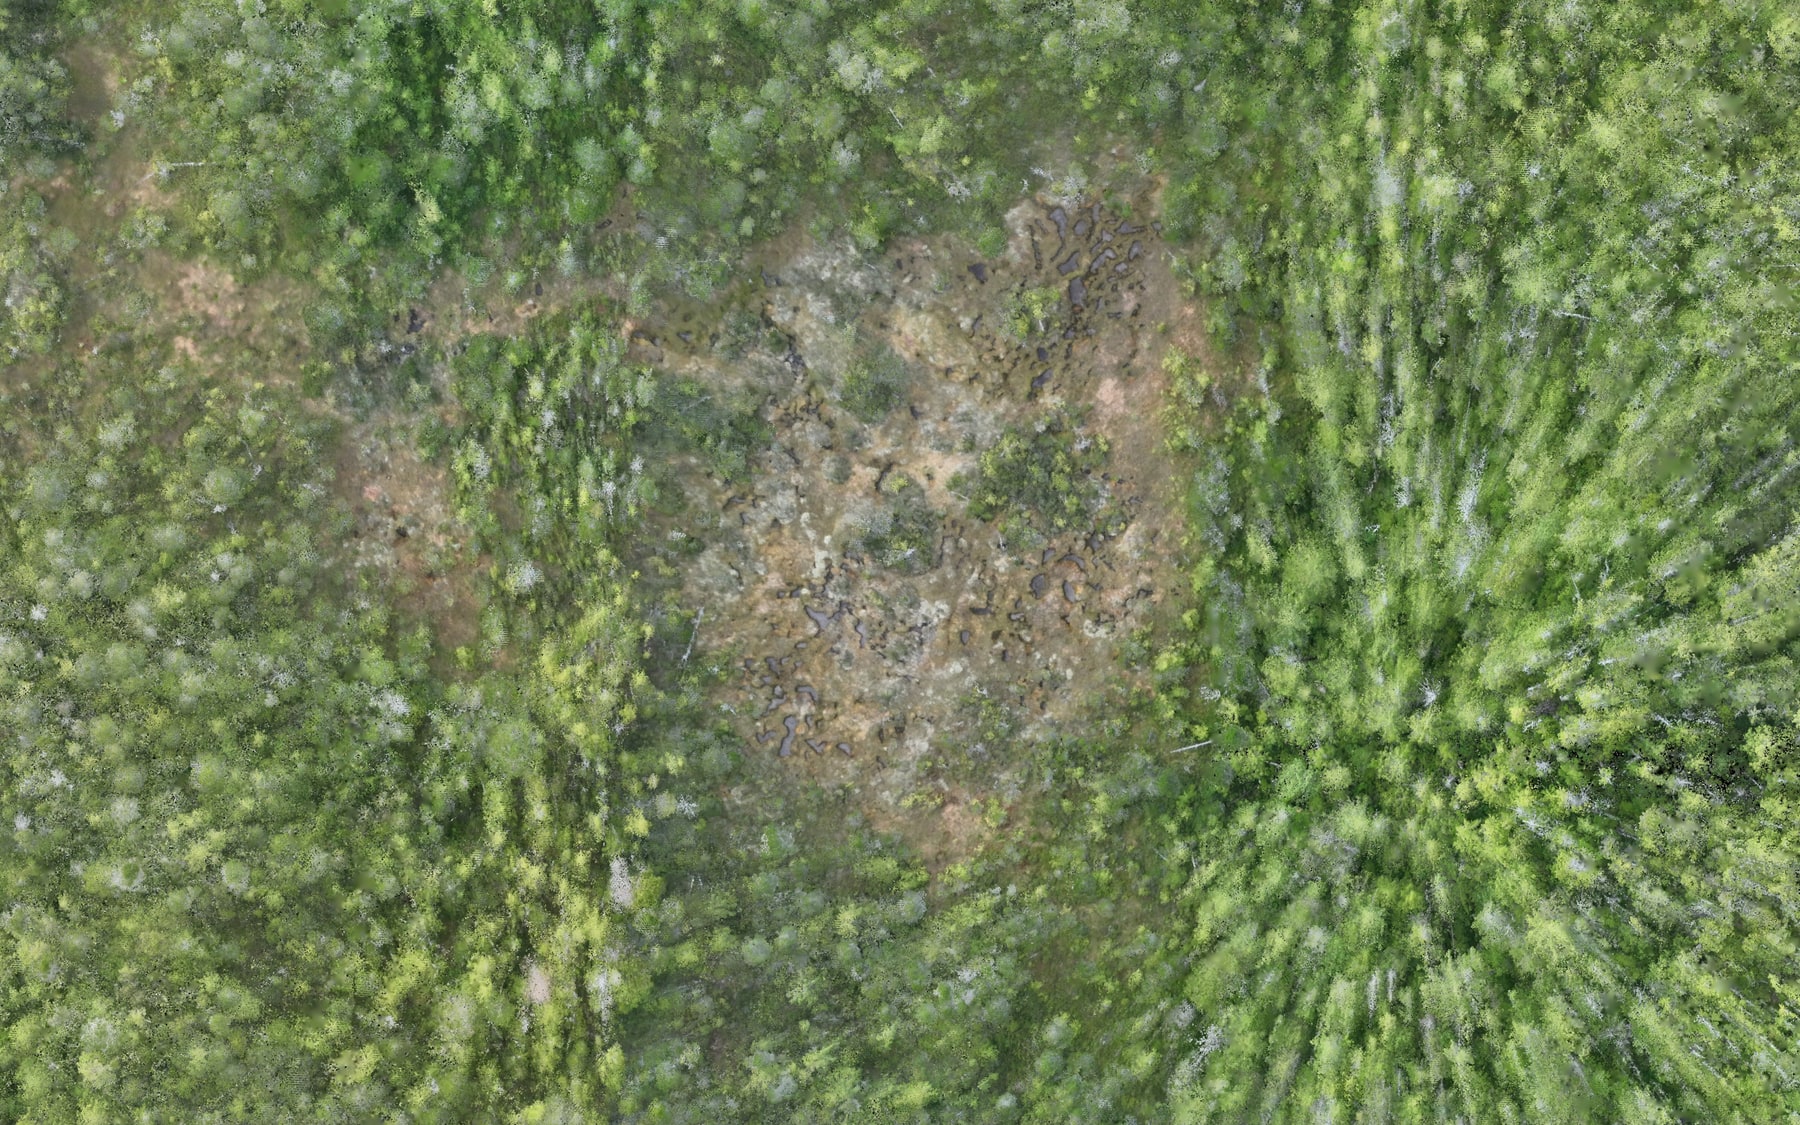
6. The orthophoto
PCI flies a camera alongside the LiDAR, so the same flight also produces a georeferenced orthophoto at a few centimetres per pixel. It is the deliverable everyone on the project can read without training, and overlaid on the terrain model it puts the photo and the measurement in the same coordinate space.
Delivered as: GeoTIFF
The accuracy report
Every package also includes a processing and accuracy report: the control used, the checkpoint results and the accuracy achieved. That is not a formality. Every PCI LiDAR flight is tied to GNSS control and validated against independent checkpoints, and the report says exactly how well the data fits, so the accuracy your design assumes is an accuracy that was measured.
See it for yourself
The fastest way to understand a point cloud is to move around inside one. Our
interactive LiDAR demo loads 2.6 million measured points from a real PCI flight in your browser. For the field side of the work, read
drone LiDAR surveying in the Yukon; for the service itself, see
drone LiDAR and
drone mapping and photogrammetry.
Get a price for a LiDAR flight
Outline the area on the map, tell us which of the deliverables above you need and when, and you will usually see a price as soon as you submit. Remote site? Say so, and the mobilization is planned into the quote.
Request a quote or call the office nearest your project. Crews are out seven days a week, 6 a.m. to 7 p.m.